Charting
Last edited - August 28, 2026
One variable charts for primary grades
Questioning is the foundation of all learning.
The first step in rejecting not knowing is to ask, why?
Sweetland
Overview
- Introduction
- Planning information
- Background Information
- Intended Learnings
- Mathematical content
- Anticipated learner thinkings & misconceptions
- Mathematical processes
- Habits of mind - attitudes, social skills, values ...
- Scoring guides
- Pedagogical Overview
- Activity sequence
- Lessons plans
- Activity 1 - Chart my flower garden
- Activity 2 - Chart our names - Letters in our first name; Vowels in our first name
- Activity 3 - Uma Wimple Charts Her House & we chart our classroom
- Activity 5 -
- Activity 6 -
- Lab notes
- Lab note 1 - Chart my flower garden
- Lab note 2a - Chart - Letters in our first names
- Lab note 2aa - Chart - Number of letters in our first names
- Lab note 2b - Chart - The vowels in our first names
- Lab note 3 -
- Lab note 5 -
- Lab note 6 -
- Support materials
Introduction
This page includes activities with pedagogical information, for introducing and developing chart literacy in the primary grade levels along with the development of number values, classification, data analysis, and problem solving.
It has links to activities for living student charts or graphs, real lock block charts, spin and chart, and been toss charts. It discusses uses of the book Uma Wimple Charts Her House and and the book Graphs. Along with activities to chart the number of flowers in a picture of a flower garden. Actvities to chart the number of letters in the student's first names, a couple of ways, and then the number of v0wels in their first names with sample chart worksheets.
Planning information
Background information
Background information necessary is prenumber sense necessary to represent the values of the data in introductory activities activities such as the following:
- Living chart & graphs - Learners line up physically in rows based on categories like their birth month or how they get to school (bus, car, walk, other)to create a real-life bar chart in the classroom. How many letters are in their first name colors of right shoe.
- Lock Block Charts & Graphs - Have pairs of learners grab two random handfuls of multi-colored connecting cubes, sort them by color, and stack them into physical columns to directly compare which stack is taller. Then transferr their data to paper by tracing around each stack or coloring squares to make a chart. Have them label the bottom (Cube colors), side (Number of cubes, and put a title (Cube grap).
- Spin and Chart or Graph - Pairs of learners spin a paperclip spinner multiple (10) times, tally the results using tally marks, and color in a blank bar worksheet to compare the outcomes. Have them label the bottom (Color), side (Numberof spins), and put a title (Spin colors for 10 spins).
- Bean toss chart or graph - Sticky note chart for addends of different sums.
Literature resources
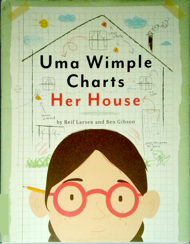 Uma Wimple Charts Her House. by Reif Larsen and Ben Gibson
Story plot
Uma's teacher gives the class what Uma thinks is a dream assignment. Make a chart of our own home. However, Uma who draws doodles, sketches, maps, and charts her world, isn't sure she knows what makes a house housey? Uma figures it is her family. family love levels that is shared inside the house's walls. She chart shows the Wimple family love levels and a diagrm that illusrates her family and many attributes of her house.
If you are looking for a how to chart book, this might not be it. There are charts among the illustrations and the inside covers have an example of a pie chart, bar chart, venn diagram, pyramid chart, map, and tree. I think its best use would be to review different ways to represent data, which along with these examples there are many illustrations used to represent ideas like kinds of roofs, brick patterns and other attributes of houses and homes.
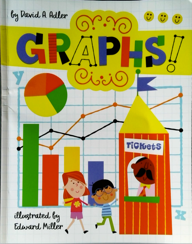
Graphs. by David A. Adler and artist Ed Miller.
As the summary below details, there are more charts in the book than graphs. Providing an introduction to graphs by comparing and contrasting charts with graphs. While it provides information to introduce graphs by comparing them to charts, I was disappointed by the title hoping for more information on graphs.
Story Plot
Janet and Ben are at a Carnival and describe the color of the Ferris wheel cabins, the bumper cars, people in line, height of people in line for the roller coaster and the temperature during the day and compare it to yesterday.
After each of their descriptions, the author describes how the data can be represented.
- Bar charts for the number of different colored cabins on the Ferris Wheel. One with color numbers horozontal and vertical.
- Color of bumper cars and Ferris wheel cabins are displayed in a double bar graph.
- The pattern continues with a description from the carnaval followed by a repesentation of the data.
- A pictograph of people in line for four rides.
- A histogram for the height of people in line for the roller coaster.
- A line graph for the day's temperature.
- A double line graph by adding yesterday's temperature.
- And a pie chart for people's favorite rides at the carnival.
- Ending with a double page spread of six more examples. Favorite colors, Number of boooks sold, How kids get to school, food sold at the carnival, entrance tickets sold, and snow days.
Excellent picture book to review charts, introduce graphs, and provide examples that can be used to brain storming events or information from which to collect data and represent it in charts and graphs.
Intended learnings
Charting and graphing K-3 mapping
K - 3 average, chart, bar graph, concrete real object graph, data, grid, picture graph, table, tally, trial.
Charts are powerful ways to communicate information about data (objects, people, thoughts, ideas, emotions, characteristics, likes, & dislikes).
In the primary grades comparisons is the focus.
Bar charts to compare the frequency of different groups or categories of data side by side. (objects, people, thoughts, ideas, emotions, characteristics, likes, & dislikes)
Column charts, similar to bar charts, but use vertical columns to show item differences over a short period or across categories. These are a good way to introduce one variable statistics - with a one variable chart that displays data for a single variable and show its distribution - frequency (how often a value occurs) or range of values (highest to lowest) & measures of central tendencies (mean, median, mode), or trend. Examples include bar charts, histograms, and pie charts.
- Sample problems for one variable statistics
- Number of stars in a minute,
- How many M&M's of each color are in a package?
- Plant growth unit with graphing plants height.
- Chart the number of letters in their first name and last name
- Chart both the ages of learners in years and months
- Bean toss - chart frequence of sums
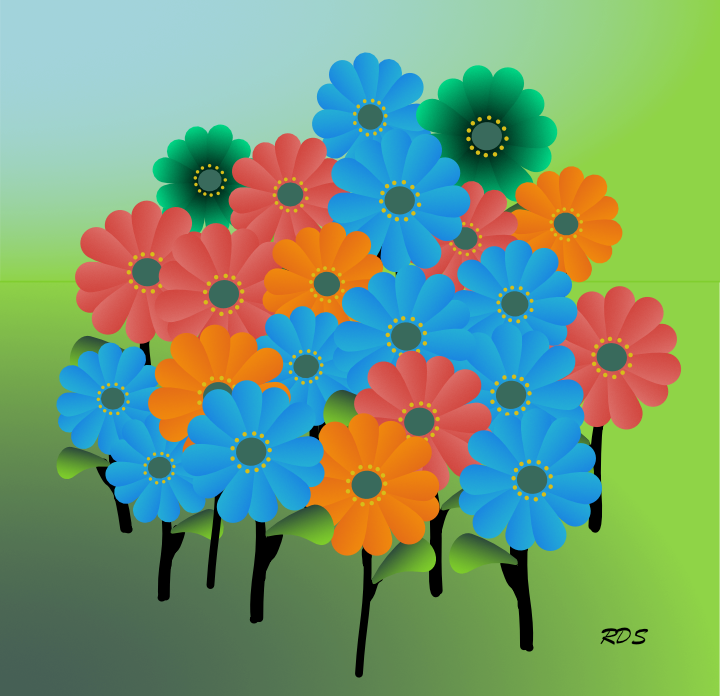
How many of each type of flower is there? Make a chart to show their population!
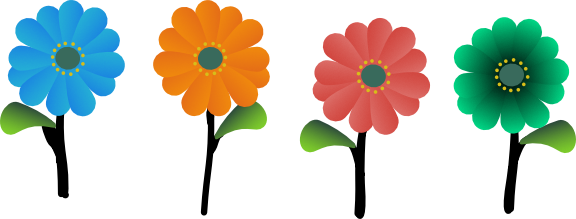
Use the flowers in your chart!
Social skills - Groups
Working in groups reduces stress and stereotyping: Groups provide a lower risk free environment to participate, make mistakes, and look for solutions.
Additionally learners sometimes view math more as a male subject or other racial preferences rather than gender and racial neutral.
Both can cause them to begin to doubt their competence in math and can believe they can't do math.
Most learners, including females, tend to learn math better when taught using groups rather than the traditional competitive classroom methods of teacher demonstrating and lecturing.
Making this a truly cooperative lesson would further reduce the competition.
Activities that are a cooperative endeavor in finding solutions and justifying them rather competition against accuracy rather than time will also encourage more students.
Asking each learner group to prepare as an expert to demonstrate his or her method to his or her peers can provide motivation and focus.
Mathematical content - number value, geometry, measurement, algebra, data analysis, statistics, and probability
(What mathematics explains - enduring understanding, big ideas, generalizations)
Sets of related numbers can be visually represented in charts and graphs.
Concepts and facts - from algebra & patterns ...
- Charts are a visual representation of a distribution of a set of data.
Outcome
- Solve and demonstrate the solutions to problems using charts.
Specific outcomes -
- Decide how to collect data.
- Set up and label a chart.
- Labeling the key using the correct units.
- Provide a title that is a relationships.
Anticipated learner thinkings & misconceptions
(Source concepts & misconceptions)
Miconception - as concepts
- Charts only represent numbers.
Miconception - as outcomes
- Don't use a consistent scale that creates distorted data.
- Misplacing data points in the wrong column.
Mathematical Processes - Problem solving, representation, proof and reasoning, communications, and connections
(How mathematics inquires - process, skill, methodology)
Together people can use a general problem solving procedure to solve problems and verify their answers with different solutions to better convince each other of their validity.
Concepts and facts -
- Solving problmes can be assissted with a problem solving heuristic.
Outcome
- Solve a problem using a problem solving heuristic.
- Use different representations to communicate, by demonstrating solutions.
Specific outcomes -
- Problem solving heuristic includes general steps for solving mathematical problems
- Use graphs to represent equations and mathematic relationships of variables.
- Solve two equations with two unknowns using four methods: graphing, substitution, addition, and determinants.
- Communicate with peers of the same and opposite sex mathematical ideas.
Habits of mind - values, attitudes
(Attitudes and values that contribute to mathematical success)
Curiosity, open-minded, skepticism, persistence, .
Concepts and facts -
- Both sexes are equally capable of learning and teaching math.
- Diverse populations can achieve similar results.
- Cooperation brings together diverse ideas for the benefit or all.
Outcome - cooperation and planning
- Develop attitudes and skills for cooperation.
- Develop planning skills.
Specific outcomes -
- Cooperations looks, sounds, and feels like:
Scoring guides suggestions (rubric)
Graph creations (scoring guide)
Correctly graph a set of equations on the same Cartesian coordinate system
- Decide what data to collect to answer a question.
- Collect necessary and sufficient data to answer their question.
- Set up and label a chart to display their data.
- Labeling the chart using accurate units.
- Provide an appropriate title.
Communication of mathematical ideas.
Habits of mind for cooperation - listen, don't interrupt, respond to others ideas, use others ideas as example or as showing an exception
Pedagogical Overview & Strategies to achieve educational learnings
Based on learning cycle theory & method for instruction
Activities Sequence to provide sufficient opportunities for students to achieve the targeted outcomes.
Make sure learners have the prior knowledge identified in the background information.
- Activity 1 - Chart my flower garden
- Activity 2 - Chart our first names - Three ways, actual letters, total number of letters, and number of vowels
- Activity 3 - Uma Wimple Charts Her House & we chart our classroom
- Activity 4 -
- Activity 5 -
- Activity 6 -
Vocabulary
- Data - information we collect for a purpose. (for reference or analysis).
- Tally - a mark to represent a number. A way to count.
- Chart - a representation of data.
- Compare - to see what is the same or different or more or less.
- Inventory - a complete list of items such as property, goods in stock, or the contents of a building, classroom, or office.
Focus question
Unit focus question:
How can we make s a visual representation that describes our ___ (classroom, home, school)?
Sub focus questions:
- What categories describe our classroom/ home?
- What counts as an item in a category?
- What are the elements of a chart and how are they used?
Materials
- Sheets of different colored dots, sticky notes, tally sheet,
- Graph paper - page with 42 squares high x 32 squares wide
- Small chart - Four columns with seven boxes
- Chart 5 Columns 14 Squares - Chart vowels in first names
- Lab note 1 - Chart my flower garden
- Lab note 2a - Chart - Letters in our first names
- Lab note 2aa - Chart - Number of letters in our first names
- Lab note 2b - Chart - The vowels in our first names
- Lab note 3 -
- Lab note 4 -
- Lab note 5 -
- Lab note 6 -
Resources
Lesson Plans
Activity 1 - Chart my flower garden
Materials
Graphs. by David A. Adler and artist Ed Miller.
- Bar charts for the number of different colored cabins on the Ferris Wheel. One with color numbers horozontal and vertical.
- Color of bumper cars and Ferris wheel cabins are displayed in a double bar graph.
- Graph paper - page with 42 squares high x 32 squares wide
- Lab note
Focus questions:
- How can I make a chart for the numberof flowers in a flower garden?
Learning outcomes:
- Make a chart to represent the flowers in the flower garden.
Suggested procedures overview:
- Put students in groups, focus their attention, and assess their initial understanding of the focus questions.
- Activity -
Exploration
- Read the book or at least the first few pages about the chart of the color of cabins on the Ferris Wheel.
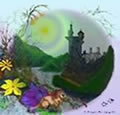
- Share the picture of a flower garden.
- Ask. How can we chart the flowers in the garden?
Ask
How many of each type of flower is there? Make a chart to show their population!
- Let the learners work in pairs.
- Make a tally for the number of flowers. Blue - 10, Orange - 3, Red- 6, Green - 2
- Graph the number of flowers in the flower garden.
Invention
- Share graphs and have them describe their process.
Discover
- Ask. What can we chart about us?
Activity 2 - Chart our names
Materials:
- Graph paper - page with 42 squares high x 32 squares wide
- Lab note 2a - Letters in our first names. Print one page for every 12 learners.
- Lab note 2aa - Number of letters in our first names
- Lab note 2 - Chart the vowels in our names
- Could have all the students write their first name on the same sheet of paper so you can photo copy it so you have it when you start the activity.
- For classes with larger number of students, may need two pages to chart the names of divide the class into groups and have each group chart the names in each group and combine them into a class chart with all the names.
Decide what to chart:
- The number of letters in their first name by charting the actual letters.
Lab note 2a - Letters in our first names
- The total number of students with the total number of letters in their first name. Number of student names of two letters in their first names, three, four, ...
Lab note 2aa - Number of letters in our first names - The number of vowels in their first name.
Lab note 2b - Chart - The vowels in our first names
Focus questions:
- How can I make a chart (mathematical representation) for the number of letters in our names?
- How can I make a chart (mathematical representation) for the vowels (a,e,i,o,u) in people's first name?
Learning outcomes:
- Make a chart to represent the first names of our class.
Suggested procedures overview:
- Put students in groups, focus their attention, and assess their initial understanding of the focus questions.
- Activity - Make a chart to represent the letters in the first names of our class. Makle a chart for the number of vowels in our first names.
Exploration
- Put learners in pairs or groups.
- Ask. What are the first names for all of us in our class?
- Say, Let's all write our first name on the board.
Or hand out the sheet of paper you photo copied that each class member printed their name. - Ask. How many letters are there in each of our names?
- Ask. How can we make a picture representation of the number of letters in our names? Accept all answers.
- Decide how many names each will include on their chart. Whole class, half class, groups of ...
- Suggest to use a chart and write each name in a row with one letter in a square. Lab note 2 - Letters in our first names to make an actual letters in first names graph.
- Decide how you want to display the chart. Portrait or landscape.
- Portrait can print each name left to right.
- Landscape - Have them print each letter of each person's name in the chart with one letter is in a square starting at the bottom of a column and going up for each name.
- Have them chart the number of letters in their first names? Using Lab note 2 - Letters in our first names to make an actual letters in first names graph.
- Let them complete their charts.
Invention
- Share the charts.
- Ask. What name(s) has/have the least?
- Ask What name(s) has/have the most?
- Ask. Other questions and try to include a question with an answer for each of the names.
- Discuss how it is easy to see the first name with the most and least.
- Ask. How many names have ___ (number like four) letters?
- After they count, suggest it might be interesting to count the number of letters for each name.
- Suggest to use tallies to tally the number of letters for each name and write it beside the name.
- Ask. If there is a way they could make a picture representation for the number of letter in all of their names? Accept all answers
- Suggest a chart using the data collected with their tallies for their first names.
- Share the Lab note 2aa - Number of letters in our first names.
- Can use a class display of the chart and fill in one square for the tallies (number of letters in each name) for each name in an apppropriate place according to the total number of letters in the name. Can have students till in their lab notes along with.
- Use the chart to ask and answer questions.
- What is the least number of letters in a first name? has/have the least?
- What is the most number of letters in a first name?
- What is the number of letters in a first name that occurs the most?
- What is the numbers of letters that don't occur?
- Ask and answer more questions with the chart.
- Ask. What are the names with the most letters?
- Discuss that the chart doesn't have that information.
- Discuss how a chart represents different ways to picture information.
- Ask. How did the flower chart, represent information?
- How did the two first name charts represent information.
- Summarize that a chart is made according to what information that people want to represent in a picture.
- Ask. If we wanted to know the vowels that are in all of our first names, how would we collect the data and how would be represent it. Accept all answers.
Discovery
- Ask. What are the vowels in your name?
- Use the list of first names to verify what vowels are in their first names.
- Display a list of the vowels in the first names of all the learners in the room.
- Ask. How many a's? Tally and record the total.
- Ask. How many e's? Tally and record the total.
- Repeat for i, o, u; if they are included in the names.
- Chart the number of vowels. Use Lab note 2b - Vowels in our first names
- Complete the chart together or let learners complete theirs and gather together to share results.
Activity 3 - Uma Wimple Charts Her House & we chart our classroom
Materials
- Uma Wimple Charts Her House. by Reif Larsen and Ben Gibson - Uma's teacher gives the class what she thinks is a dream assignment. Make a chart of their own homes. However, she isn't sure what makes a house housey? Uma figures oit is her family. The love that is shared inside a house's walls.
- Graph paper - page with 42 squares high x 32 squares wide
- Lab note
Focus questions:
- What is a chart?
- What does it mean to chart a home?
- How are the charts the same and different?
- What kind of data or information was collected in the story?
- What are the different ways to organize the data?
- What are the different ways to represent information?
- What makes a house, housey?
- How did Uma represent her home?
- What are love levels?
Transition from house to school classroom.
- How could we make a plan to find out what is in our classroom, organize it, and make sense of what we see? (desks, chairs, bookshelves windows, cubbies, plants, books, ...) What is a chair? Something to sit on? (bean bag, stool, carpet square?
- How do we define each category?
Learning outcomes:
- Decide what might represent a classroom. How to count them, count them, and represent them on a chart.
Suggested procedures overview:
- Put learners in groups, focus their attention, and assess their initial understanding of the focus questions.
- Activity -
Exploration -
- Put learners in pairs.
- Read the book Uma Wimple Charts Her House. or explain what an inventory is and suggest they make an inventory of the classroom. Inventory - a complete list of items such as property, goods in stock, or the contents of a building, classroom, or office.
- Sample book questions:
- What kind of information is collected by the characters in the book?
- What different ways did they organize the data?
- How is the bumper car and Ferris wheel data the same?
- How could they figure out how many were in each line?
- What would you want to know about the student's height?
- How could you collect information about people's favorite rides?
- What is special about the title for each chart?
- How does the tile help for each chart?
- What is on each side?
- What is on the x-axis and y-axis?
- How are the charts different and the same?
- How would you decide to use a bar graph or a picture graph?
Invention -
- Explain and discuss with the learners.
- Have them explore the book with a notice and wonder page.
- Could something be counted in more than one category?
- What does independent mean?
- What is a double bar graph? When would you use it?
- What is a pictograph?
- What is the difference between a bar chart and line graph?
- What kind of data does a pie chart represent well?
- Make an anchor chart: What do good graphs have? title, accurate clear scale, labels, organized data, accruate comparison.
- Whys is starting the scale at zero important?
Discover
- What are you curious about in the classroom?
- What questions could we answer by collecting data?
- How we get to school?
What do we do when we get home? - Explore questions and ask how to make a plan to answer some.
Choose a question.
Decide how to answer it. survey co unt measure tally
- Collect information in pairs with tally sheets
- Organize the data with a frequency chart.
- Decide what type of chart woul be best to represent the data.
- Use graph paper, dots, sticky notes, real objects, to design the graph.
- Are all the important elements of a chart included?
- Evaluate with questions such as
- How does the type of graph you chose fit the data?
- How is the chart clear for others to understan?
- How does the title focus on attention on the purpose of the chart?
- What elements make the chart informational?
Activity 4 -
Materials
- Graph paper - page with 42 squares high x 32 squares wide
- Lab notes
Focus questions:
- How does
Learning outcomes:
- Learners
Suggested procedures overview:
- Put students in groups, focus their attention, and assess their initial understanding of the focus questions.
- Activity -
Exploration
- Ask.
Invention
- Ask. How
Discover
Activity 5 - Tee shirt decisions
Materials:
- Graph paper - page with 42 squares high x 32 squares wide
- Lab notes
Focus questions:
- How do we determine t
Learning outcomes:
Suggested procedures overview:
- Put students in groups, focus their attention, and assess their initial understanding of the focus questions.
- Activity -
Exploration
- Organize learners into pairs or larger groups.
Exploration
- Put learners into groups.
- Present them with the
Invention
- Each group explains their chart.
Discovery
Activity 6 -
Materials
Focus questions:
- What are the different ways to
Learning outcomes:
Pedagogical ideas
The jigsaw model asks learners to understand a method of solving equations, communicate their understanding to her or his peers, and to attempt to help the other group members to understand it and plan a demonstration for the method to the other peers. This enables every class member to have an area of expertise and empowers all learners to be valuable and capable among their peers, which helps improve their self-efficacy with math and social communications with peers.
Suggested procedures overview:
- Put students in groups, focus their attention, and assess their initial understanding of the focus questions.
- Activity - Have learners use the jig-saw method to learn and prepare to be an expert to demonstrate one of the four ways to solve problems with two unknowns.
- Repeat the process four time.
- Identify problems and select solution methods and discuss reasons for selecting each method.
Possible Activity Sequence
Exploration
- Organize learners into groups and pairs.
- Put learners into four work alike groups with eq
Invention
- Each learner in
Discover
- Have lear
Lab Notes for activities
Lab notes 1a-
Materials
- Lab notes
Focus questions:
- How can I make a mathematical representation for ?
Challenge
How can I chart the flower in the picture of this garden?
Make tallies for each flower.
Lab notes - Flower garden
Graph the flowers in the garden.
__________________________________________________________________________

Lab notes 2a - Letters in our first names
Materials
Focus questions:
- How many letters are in our first names?
Challenge
Make a letters in our first name chart. Write the first name of students, one letter in a square, for each name on a line.
First Names:

Lab notes 2aa - Number of letters in our first names
Materials
Focus questions:
- How many letters are in our first names?
Challenge
Make a chart by filling squares according to names with the same number of letters.
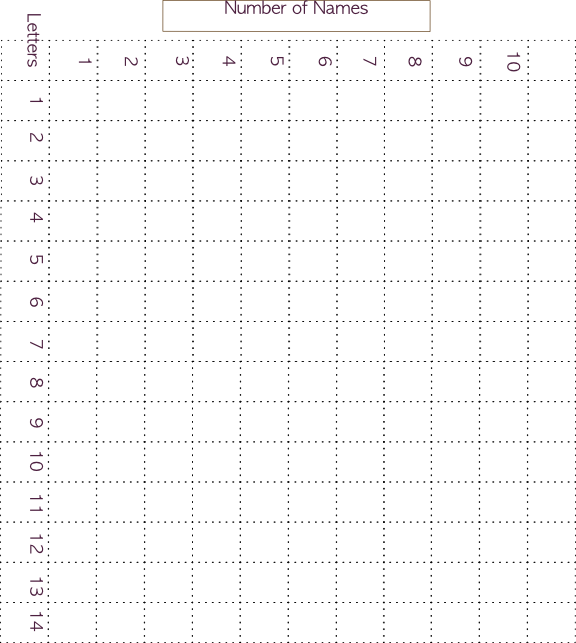
Lab notes 2b - Vowels in our first names
Materials
Focus questions:
- How many of each vowel is in our first names?
Challenge
Make a chart for vowels in our first names.

Lab notes 3 - Uma Wimple Charts Her House & we chart our classroom
Materials
- Graph paper - page with 42 squares high x 32 squares wide
Focus questions:
- How
Challenge
Lab notes 4 -
Materials
- Graph paper - page with 42 squares high x 32 squares wide
Focus questions:
- How can
Challenge
Lab notes 5 -
Materials
- Lab notes, graphing calculator, graphing data sheet,
Challenge
Substitution -
Addition -
Determinants
Support materials
Chart cubes
Color one square for each cube.

Spinner game
Directions:
- Spin a four colored spinner 10 times.
- Record the data with tally marks.
- Color one square for each color spun.
Spinners
Print the spinners on oak tag, color them, and attach a paper clip with a paper fastener.