

Graphing & charting
One variable & two variables
Questioning is the foundation of all learning.
The first step in rejecting not knowing is to ask, why?
Sweetland
Overview
- Introduction
- Planning information
- Background Information
- Intended Learnings
- Mathematical content
- Anticipated learner thinkings & misconceptions
- Mathematical processes
- Habits of mind - attitudes, social skills, values ...
- Scoring guides
- Pedagogical Overview
- Activity sequence
- Lessons plans
- Activity 1 - Meat or cheese sandwich
- Activity 2 - Make it your way
- Activity 3 - Make it your way
- Activity 4 - Graphing patterns - from pattern to graph
- Activity 5 - Tee shirt decisions
- Activity 6 - Not all data makes nice line graphs.
- Activity 7 - Solving for two unknowns four ways. (8-12 Grade)
- Graphs that curve
- Drag race quarter mile
- Products To 25
- Lab notes
- Lab note 1 - Meat or cheese sandwich
- Lab note 2 - Make it your way
- Lab note 3 - Make it your way
- Lab note 4 - Graphing patterns - from pattern to graph
- Lab note 5 - Tee shirt decisions
- Lab note 6 - Not all data makes nice line graphs.
- Lab note 7 - Solving for two unknowns four ways. (8-12 Grade)
- Support materials
- Solutions for Solving for two unknowns four ways
- Python code to generate bar chart for factors less than 20
Introduction
This page includes suggestions for teaching and developing graphing literacy across K-12 grade levels. Includes activities for for developing graphing of one and two variable graphing and data analysis. And graphing as one of four ways to solve two variable problems in algebra with pedagogical information.
Related graphing resources
- Early charts & pregraphing - physical charts, charts, & introductory graphing activities
- Patterns - 24 investigation activities to discover the different patterns and formulas to represent them and their relationships
- Coordinate Graphing Notes - Data sheet for coordinate graph, manipulated, responding, independent, dependent, variables, relationships, extrapolation, interpolation, continuous & categorical data to use for data analysis of variables and their relationships.
- Graph paper - 2 cm squares (11 high 9 wide
- Graph paper - page with 42 squares high x 32 squares wide
- Functions - Explains how a function is a relationship with one value.
- Graph, the math representations behind the modern graph - Story of Nicole Oresme, Father of the modern graph, or as he would say: the Latitude of Forms
- History of graphing software: The Graphing Calculator Story by Ron Avitzur, then below the article are links to download the software.

Planning information
Background information
While this page includes information to review and build on the use charts, you may want to review additional background information in a primary level charting unit.
Background information necessary is the understanding of number values for the values used to represent the data along with what ever problem solving and data analysis necessary to complete the graphs.
Intended learnings
Charting and graphing K-9 mapping
K - 3 average, bar graph, concrete real object graph, data, grid, picture graph, table, tally, trial.
- One variable statistics - Introduction to a one variable chart. To displays data for a single variable and show its distribution - frequency (how often a value occurs) or range of values (highest to least) & measures of central tendencies (mean, median, mode) , or trend. Examples include bar charts, histograms, pie charts, and line graphs with only one dependent variable.
- Sample problems for one variable statistics
- Ping-Pong Ball Race
- Number of stars in a minute,
- How many M&M's of each color are in a package?
- Plant growth unit with graphing plant height
- M&M® Challenge - activity directions and worksheets for data analysis, mean, median, mode, & graphing of colors of M&M's. Can be used for probability.
- Chart the number of letters in their first name and last name
- Chart both the ages of learners in years and months
- Bean toss - chart frequency of sums
- Sample problems for one variable statistics
4 - 6 broken line graph, descriptive statistics, equally likely events, extrapolate, frequency, generalization, histogram, inference, interpret, interpolate, line graph, line plot, mean, media, midway, mode, ordered pair, outcome, probability, quadrant, random, range, ratio, sample, scale drawing,g simple event, statistics.
- Continue with one variable charts and graphs. A one variable line graph with only one dependent variable shows how a single variable changes over time or across a sequence. The x-axis usually represents time or categories, and the y-axis shows the variable's value, with points connected by a line to reveal trends or patterns. Graph rate of motel prices for different Monopoly places.
- Use the rate of water flow from a shower head to graph the gallons of water used for a shower from 0-20 minutes. Find how much water is used when taking a bath in a regular and jacuzzi tub. Use the information to decide under what conditions it is better to take a bath or shower to conserve on water.
- Pictures plots to practice plotting on a Cartesian Graph - Worksheet to plot a picture and create your own points to plot. Source Johnnie Ostermeyer
- Find your class's hang time and vertical jump statistics - worksheet range, median, mean, mode, graph.
- Graphs as pictures tennis ball and wadded paper toss and graph -
- Pendulum swinging - Change or no change. Relationship or no relationship. Swing a pendulum by changing variables of mass, graph, then repeat with different string lengths.
7 - 9 box plot, compound event, circle graph, error of measurement, extrapolate, mutually exclusive, outlier, quartile, scatter plot, skew, lines stem and leaf plot, whisker. What is the region bounded by y=sin(kx)+2, x=0, x=2π, and y=0, with k constant.
Social skills - Groups
Working in groups reduces stress and stereotyping: Groups provide a lower risk free environment to participate, make mistakes, and look for solutions.
Additionally learners sometimes view math more as a male subject or other racial preferences rather than gender and racial neutral.
Both can cause them to begin to doubt their competence in math and can believe they can't do math.
Most learners, including females, tend to learn math better when taught using groups rather than the traditional competitive classroom methods of teacher demonstrating and lecturing.
Making this a truly cooperative lesson would further reduce the competition.
Activities that are a cooperative endeavor in finding solutions and justifying them rather competition against accuracy rather than time will also encourage more students.
Asking each learner group to prepare as an expert to demonstrate his or her method to his or her peers can provide motivation and focus.
Mathematical content - number value, geometry, measurement, algebra, data analysis, statistics, and probability
(What mathematics explains - enduring understanding, big ideas, generalizations)
Sets of related numbers can be visually represented in charts and graphs.
Concepts and facts - from algebra & patterns ...
- Charts are a visual representation of a distribution of a set of data.
- Graphs are a visual representation of a relationship between variables.
- A system can have any number of equations and any number of variables.
- When there are only two variables it is possible to visualize the relationship with a graph on a coordinate plane.
- Each person in the world could pick a different three points on a line, because there are infinite ordered pairs as solutions for any line. All of which will graphed with the same line.
- Simultaneous equations can be represented with graphs.
- Systems of equations are dependent, consistent and independent.
- Substitution and elimination methods can be used to solve simultaneous equations.
- A system of equations is two equations that share variables.
x + y =10; -3x + y = 2 - A system of equations can be represented graphically in different ways:
- Variables are conditions that can be changed and that can affect outcomes.
- Variables can represent, size, shape, temperature, amount, volume, rate, ...
Outcome
- Solve and demonstrate the solutions to problems using graphing
- Solve problems with graphing, substitution, addition, and determinants. Activity 6
Specific outcomes -
- Set up and label a coordinate system.
- Understanding Cartesian coordinate systems (labeling axes, plotting points, ordered pairs, scaling axes, etc.
- Equations for straight line and forms of linear equations y=mx + b.
- Understanding of slope
- Parallel and perpendicular lines and their equations.
- Provide appropriate scale.
- Represent given equation graphically, accurately and neatly.
- Plot points accurately and neatly.
- Identify the solution set from the graph as an ordered pair.
- Accurately identify the variables.
- Translating the word problem into an equation.
- Labeling the axes using the correct units.
- Provide a title that is a relationships.
Anticipated learner thinkings & misconceptions
(Source concepts & misconceptions)
Misconception - as concepts
- Graphs only represent numbers. Not a relationship between a two sets of related values.
- Slope is the rise or the run.
- All equations produce straight lines, even quadratic, cubic, or exponential.
Misconception - as outcomes
- Confusing x and y: Plotting points with coordinates reversed or mixing up which axis is x vs. y.
- Use rise or run instead of slope as the relationship of rise over run.
- Misinterpret negative slopes.
- Think the x and y intercepts are the same or forget to check where the line crosses the axes.
- Miss plot points
- Use a scale that creates distorted graphs.
- Plotting only one point and guess the graph's shape.
- Misread negative values .
- Placing points in the wrong quadrants.
Mathematical Processes - Problem solving, representation, proof and reasoning, communications, and connections
(How mathematics inquires - process, skill, methodology)
Together people can use a general problem solving procedure to solve problems and verify their answers with different solutions to better convince each other of their validity.
Concepts and facts -
- Solving problems can be assisted with a problem solving heuristic.
Outcome
- Solve a problem using a problem solving heuristic.
- Use different representations to communicate, by demonstrating solutions.
Specific outcomes -
- Problem solving heuristic includes general steps for solving mathematical problems
- Use graphs to represent equations and mathematic relationships of variables.
- Solve two equations with two unknowns using four methods: graphing, substitution, addition, and determinants.
- Communicate with peers of the same and opposite sex mathematical ideas.
Habits of mind - values, attitudes
(Attitudes and values that contribute to mathematical success)
Curiosity, open-minded, skepticism, persistence, .
Concepts and facts -
- Both sexes are equally capable of learning and teaching math.
- Diverse populations can achieve similar results.
- Cooperation brings together diverse ideas for the benefit or all.
Outcome - cooperation and planning
- Develop attitudes and skills for cooperation.
- Develop planning skills.
Specific outcomes -
- Cooperations looks, sounds, and feels like:
Scoring guides suggestions (rubric)
Graph creations (scoring guide)
Correctly graph a set of equations on the same Cartesian coordinate system
- Set up and label a coordinate system
- Understanding Cartesian coordinate systems (labeling axes, plotting points, ordered pairs, scaling axes, etc.
- Equations for straight line and forms of linear equations
- Understanding of slope
- Parallel and perpendicular lines and their equations
- Provide appropriate scale
- Represent given equation graphically, accurately and neatly
- Plot points accurately and neatly
- Identify the solution set from the graph as an ordered pair
- Accurately identify the variables.
- Translating the word problem into an equation.
- Labeling the axes using the correct units.
- Provide a title that is a relationships.
Solve equations using graphing, substitution, addition, and determinants (scoring guide)
Graph linear equations, systems of equations
- Identify solution sets for systems of equations from graphs
- Identify systems of equations that are parallel/inconsistent.
- perpendicular/consistent, dependent and independent
- Identify solution sets
- Interpret algebraic, graphic and verbal representations of systems of equations
- Solve systems of equation using substitution
- Solve systems of equations using elimination
- Identify systems of equations that are consistent, inconsistent, dependent and independent
- 9. Graph solution sets after solving systems of equations algebraically
- Students will use large chart paper to reproduce o the graphs for display
Communication of mathematical ideas.
Habits of mind for cooperation - listen, don't interrupt, respond to others ideas, use others ideas as example or as showing an exception
Pedagogical Overview & Strategies to achieve educational learnings
Based on learning cycle theory & method for instruction
Activities Sequence to provide sufficient opportunities for students to achieve the targeted outcomes.
Make sure learners have the prior knowledge identified in the background information.
- Activity 1 - Meat or cheese sandwich
- Activity 2 - Make it your way
- Activity 3 - Select a pattern and graph
- Activity 4 - Graphing patterns
- Activity 5 - Tee shirt decisions
- Activity 6 - Not all data makes nice line graphs
- Activity 6 - Solving for two unknowns four ways. (8-12 Grade)
- Graphs that curve
- Drag race quarter mile
- Products To 25
Focus question
Unit focus question:
How can we make s a visual representation for an equation or mathematical relationship of a variable or two variables.
Sub focus questions:
- What are the elements of a graph and how are they used. - Coordinate Graphing Notes
Materials
- Coordinate Graphing Notes
- Graph paper - page with 42 squares high x 32 squares wide
- Lab note 1 - Meat or cheese sandwich
- Lab note 2 - Make it your way
- Lab note 3 - Select a pattern and graph
- Lab note 4 - Graphing patterns - from pattern to graph
- Lab note 5 - Tee shirt decisions
- Lab note 6 - Not all data makes nice line graphs
- Lab note 7 - Solving for two unknowns four ways. (8-12 Grade)
- Graphs that curve - drag race quarter mile
Resources
Lesson Plans
Activity 1 - Meat or cheese sandwich
Materials
- Coordinate Graphing Notes
- Graph paper - page with 42 squares high x 32 squares wide
- Lab note
Focus questions:
- How can I make a mathematical representation for sandwiches?
Learning outcomes:
- Make a table for 1o - meat - bologna or - American cheese on two sliced of bread and then represent it on a graph.
Suggested procedures overview:
- Put learners in groups, focus their attention, and assess their initial understanding of the focus questions.
- Activity - Make a table for 1o - meat - bologna or - American cheese on two sliced of bread and then represent it on a graph.
Exploration -
- Put learners in pairs.
- Ask. How can we make a mathematical representation for sandwiches?
- Say you need to make ten sandwiches how many slices of bread and how many pieces of cheese do you need? for one sandwich, 2 sandwiches, 3 sandwiches, 4 sandwiches, ... 10 sandwiches?
- Decide if you will make 10 meat - bologna or - American cheese sandwiches.
- Then fill in the table for how many pieces of say cheese and slices of bread you will need for 1 - 10 sandwiches.
- Display results for all to see.
Invention -
- Explain and discuss with the learners.
Discover
Next activity ...
Activity 2 - Make it your way
Materials
- Coordinate Graphing Notes
- Graph paper - page with 42 squares high x 32 squares wide
- Lab note
Focus questions:
- How can I make a mathematical representation for sandwiches?
Learning outcomes:
- Design a sandwich made your way (with up to 6 fix-ens), make a table to show the ingredients needed for 1 -1o sandwiches, and then represent it on a graph.
Suggested procedures overview:
- Put learners in groups, focus their attention, and assess their initial understanding of the focus questions.
- Activity - Design a sandwich made your way (with up to 6 fix-ens), make a table to show the ingredients needed for 1 -1o sandwiches, and then represent it on a graph.
Exploration
- Put learners in pairs.
- Tell. Now you can add more to their sandwich. Say meat, cheese, 3 slices of pickles, ...
- Challenge them to create their own sandwich with up to 6 fix-ens.
- Design their sandwich, complete the table, and graph the ingredients with different colors on a graph.
Invention
- Share their graphs and explain the linear relationships.
- Have them describe how relationships, that increase at the same rates, have the same graphs.
- Discuss how this can be important to communicate mathematical ideas.
Discover
Short preview for next activity.
Activity 3 - Select a pattern and graph
Materials
- Patterns - 24 investigation activities to discover the different patterns and formulas to represent them and their relationships
- Coordinate Graphing Notes
- Graph paper - page with 42 squares high x 32 squares wide
- Lab notes
Focus questions:
- How can patterns be represented with a graph?
Learning outcomes:
- Learners will explain the pattern and represent it on a graph.
Suggested procedures overview:
- Put students in groups, focus their attention, and assess their initial understanding of the focus questions.
- Activity - Learners will explain the pattern and represent it on a graph.
Exploration
- Select one of the Patterns to work together to represent in on a graph.
- Ask. Is this a pattern?accept all answers
- Explore the pattern, explain how it changes, and represent it on a graph.
- Create a procedure to make a graph from a pattern.
- Collect enough data, represent it in a char or table.
Invention
- Have group or together as a class use the procedure and data to make a graph.
- Display graph or graphs.
- Ask. Can you select a pattern and create a graph for it?
Discover
Next activity - Graphing patterns - from pattern to graph
Activity 4 - Graphing patterns - from pattern to graph
Materials
- Patterns - 24 investigation activities to discover the different patterns and formulas to represent them and their relationships
- Coordinate Graphing Notes
- Graph paper - page with 42 squares high x 32 squares wide
- Lab notes
Focus questions:
- How can patterns be represented with a graph?
Learning outcomes:
- Learners will form groups, select one of 24 patterns, explain the pattern and represent it on a graph.
Suggested procedures overview:
- Put students in groups, focus their attention, and assess their initial understanding of the focus questions.
- Activity - Learners will form groups, select one of 24 patterns, explain the pattern and represent it on a graph.
Exploration
- Ask. What is a pattern?accept all answers
- Share Patterns - for learners to choose from.
- Create groups for the patterns selected.
- Groups will explore their pattern, explain how it changes, and represent it on a graph.
Invention
- Share graphs, their explanations, and graphs.
Discover
Next graphing p Tee shirt ...
Activity 5 - Tee shirt decisions
Materials:
- Coordinate Graphing Notes
- Graph paper - page with 42 squares high x 32 squares wide
- Lab notes
Focus questions:
- How do we determine the best buy of T-shirts from companies with different pricing?
Learning outcomes:
- Calculate, graph, and explain similarities and differences between the cost for different amounts of t-shirts from two different companies as represented on a graph showing their relationships between quantity of shirts and their price.
Suggested procedures overview:
- Put students in groups, focus their attention, and assess their initial understanding of the focus questions.
- Activity - Use the pricing information to calculate, graph, and explain similarities and differences between the cost for different amounts of t-shirts from two different companies as represented on a graph showing their relationships between quantity of shirts and their price.
Exploration
- Organize learners into pairs or larger groups.
- Give them the pricing information and ask them to create a graph to use with a presentation to show the cost of different amounts of shirts to make a decision on which company to order from.
- Here are two companies selected for the best deals:
(10, 150) ... I&C = 15n ; UTCo = 10n + 50
Ink & Cotton
T-shirts with your team name and logo!
$15.00 per shirt (S, M, L)
Urban Tee Co.
T-shirts with your team name and logo! (S, M, L)
One time set up charge of $50.00
$10.00 per shirt
Exploration
- Put learners into groups.
- Present them with the t-shirt challenge.
- Let them create their graph and present them.
- Display graphs.
Invention
- Each group explains their graph.
- Resolve any differences between slope and where the lines intersect and diverge.
- Together write a summary.
- Summary - If we order less than ____ we should order them from Ink & Cotton. If we order ________, we can order from either. If we order more than ________ we should order from Urban Tee Co.
Discovery
- Write a similar problem to share with an other group.
- Exchange problems and create a solution.
- Share solutions
Activity 6 - Patterns that aren't nice! - Not all data makes nice line graphs
Materials
- Factors of numbers to 50 charts & 100 worksheets & notes
- Python code to generate a table of factors less than 20
- Python introduction with turtle graphics
- Coordinate Graphing Notes
- Graph paper - page with 42 squares high x 32 squares wide
- Lab notes
Focus questions:
- Is there a relationship between the size of a number and the number of factors it has?
Learning outcomes:
- Learners will form groups, and find the factors for the numbers less than 20.
Then - Learners will form groups, and find the factors for the squares of numbers from one to ten (1, 4, 9, 15, 25, 36, 49, 64, 81, & 100).
Suggested procedures overview:
- Put students in groups, focus their attention, and assess their initial understanding of the focus questions.
- Learners will form groups, and find the factors for the numbers less than 20.
Or - Learners will form groups, and find the factors for the squares of numbers from 1 to ten (1, 4, 9, 15, 25, 36, 49, 64, 81, & 100).
Exploration
- Ask. Is there a relationship between the size of a number and the number of factors it has?
- To answer this question, let's review.
- What are factors? accept all answers
- How can you find the factors for a set of numbers? Review how to find factors.
- Create groups to find the factors of numbers 1 -20.
- In your groups find the factors of numbers 1 -20. And see if you can find a pattern and relationship.
- Groups find factors, explore them, note a pattern, explain how it changes, and represent it on a chart or graph.
Invention
- Share factors, charts, graphs, and their explanations.
- See Factors & multiple - numbers to 50 table & notes
Sample chart of number of factors for whole numbers 1 - 20.
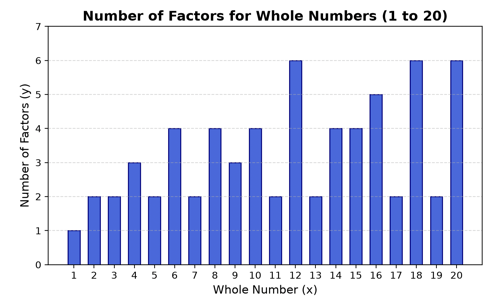
Draw conclusions that some relationships or patterns are messy.
Pattern seems one is the only number with one set of factors. Primes have two, and others go up as the number increase.
Discover
- Tell. To help see some relationships, lets focus on square numbers to 100.
- What are the squares of 1 - 10? 1, 4, 9, 16, 25, 36, 49, 64, 81, 100
- Draw each square and demonstrate how the the length of sides relate to the area and represent squares. A 2 x 2 square has sides with a length or 2 and 2 * 2 is 4 which is the number of squares in the square. Hence 2 squared is 4!
- What other four sided shape can be made with four squares? rectangle
- How many rectangles (arrays) can be with that many squares (or cells in arrays)?
- Complete the table for squares to 100.
Can ask -
How many rectangles or arrays can be made with the following? or Ask. what are the factors.
| Number to square | Square | Number of arrays | List or draw rectangles or arrays A square is a rectangle |
|---|---|---|---|
| 1 | 1 | 1 | One rectangle: 1 x 1 |
| 2 | 4 | 3 | Three rectangles: 1 x 4, 2 x 2, 4 x 1 |
| 3 | 9 | 3 | Three rectangles: 1 x 9, 3 x 3, 9 x 1 |
| 4 | 16 | 5 | Five rectangles: 1 x 16, 2 x 8, 4 x 4, 8 x 2, 16 x 1 |
| 5 | 25 | 3 | Three rectangles: 1 x 25, 5 x 5, 25 x 1 |
| 6 | 36 | 9 | Nine rectangles: 1 x 36, 2 x 18, 3 x 12, 4 x 9, 6 x 6, 9 x 4, 12 x 3, 18 x 2, 36 x 1 |
| 7 | 49 | 3 | Three rectangles: 49 x 1, 7 x 7, 49 x 1 |
| 8 | 64 | 7 | Seven rectangles: 1 x 64, 2 x 32, 4 x 16, 8 x 8, 16 x 4, 32 x 2, 64 x 1 |
| 9 | 81 | 5 | Five rectangles: 1 x 81, 3 x 27, 9 x 9, 27 x 3, 81 x 1 |
| 10 | 100 | 9 | Nine rectangles: 1 x 100, 2 x 50, 4 x 25, 5 x 20, 10 x 10 20 x 5, 25 x 4, 50 x 2, 100 x 1 |
- Can we find some relationships for these?
- Focus on the squares of primes, then squares with one prime, then squares with two different primes, and see what learners can conclude.
Possible conclusions or conjectures:
- Squares of Prime Numbers always have 3 factors - like 2, 3, 5 7; all have exactly 3 factors (1, the number itself, and the base number).
- Squares of numbers with one prime base - like 16, 64 just take their exponent (4), add 1, and you get an odd number of factors (5 ) or (6 + 1 and 7).
- Squares of numbers with two different prime bases - like 36 with 2 2& 32; or 100 with 22 & 5;2 multiply their exponents plus one together: (2+1) times (2+1) = 3 times 3 = 9 factors.
Next graphing p Tee shirt ...
Activity 7 - Solving for two unknowns four ways. (8-12 Grade)
Materials
- Resources for each problem type:
- Graphing - Lab notes, graphing calculator, graphing data sheet,
- Substitution
- Addition - and
- Determinants
- Lab notes -
- Solutions sheet for two unknowns four ways
Focus questions:
- What are the different ways to solve problems with two unknowns?
Learning outcomes:
- Solve a problem using graphing, substitution, addition, and determinants.
- Identify and explain attributes for graphing (x, y, y intercept, x intercept, slope, y=mx + b) as they apply to different problems.
- Develop a procedure for solving problems by graphing, substitution, addition, and determinants.
- Demonstrate method for solving problem by graphing, substitution, addition, and determinants; and generalize them to problems of a certain type.
- Identify variables and describe how they operate to effect other variables. (operational definition).
- Identity systems of equations as dependent, consistent and independent.
- Use substitution and elimination methods to solve simultaneous equations.
- Know a system of equations is two equations that share variables.
x + y =10; -3x + y = 2 - Demonstrate that a system of equations can be represented graphically in different ways:
Pedagogical ideas
In this investigation learner explore equations by solving problems of two equations with two unknowns in four different ways: graphing, substitution, addition, and determinants and communication what an equation and graph represent.
In addition to graphing concepts algebra concepts include.
- Systems of equations are dependent, consistent and independent.
- Substitution and elimination methods can be used to solve simultaneous equations.
- A system of equations is two equations that share variables.
x + y =10; -3x + y = 2 - A system of equations can be represented graphically in different ways:
The jigsaw model asks learners to understand a method of solving equations, communicate their understanding to her or his peers, and to attempt to help the other group members to understand it and plan a demonstration for the method to the other peers. This enables every class member to have an area of expertise and empowers all learners to be valuable and capable among their peers, which helps improve their self-efficacy with math and social communications with peers.
Suggested procedures overview:
- Put students in groups, focus their attention, and assess their initial understanding of the focus questions.
- Activity - Have learners use the jig-saw method to learn and prepare to be an expert to demonstrate one of the four ways to solve problems with two unknowns.
- Repeat the process four time.
- Identify problems and select solution methods and discuss reasons for selecting each method.
Possible Activity Sequence
Exploration
- Organize learners into groups and pairs.
- Put learners into four work alike groups with equal numbers of girls and boys in each group. Consider separating girls and boys who usually associate with each other and students at the same skill levels and other diverse groups.
- Assign each group one of four methods for solving two equations with two unknowns: graphing, substitution, addition, and determinants.
- Tell learners to use their textbooks and supplementary books to learn how to use this method. They should work together to apply the method to various problems in the books and to make sure that everyone in the group can solve the equations using the given method.
- If necessary provide a problem for each group.
- Graphing - Ralph started a lawn service business and is going to pay him self two dollars an hour more than what he is paying Chris. What equation will describe both salaries? What would the wages be for different hour amounts? What would a graph of this relationship look like?
- Graphing - Describe what each of the following are and the relationship to your problem: x, y, y intercept, x intercept, slope, y=mx + b, and create a procedure to demonstrate how to use graphing to solve real world problems and relate each of these ideas to a graphing method.
Create other problems and describe ways to decide which of the four procedures might be most appropriate.
- Substitution -
- Addition -
- Determinants -
- Once they feel confident about using the method being learned by their group, the teacher should check their problems to be sure they understand it.
- When the teacher assesses the learners understand of the method, the group can begin to design its demonstration, which will demonstrate the method to others.
- The demonstration should have four part:
- Purpose,
- Materials,
- Procedure, and
- Proof and reasoning for their confidence of the solution with their demonstrated method.
- Additionally - Each person in the group needs to make a contribution to the demonstration. The demonstration can be as long or short as the group feels is necessary to demonstrate the method and justify it's methodology. And each group member should be able to demonstrate their method.
- The teacher should assess each group’s demonstration to see how the method will be communicated and make copies of the demonstration for each student in the group.
- Reassign groups one of the four experts in each group.
- Each learner in the group should demonstrate his or her method for solving equations to the other group members.
- The learner should make sure that all of the members of the group can perform the four methods. When the groups feel they are confident about the methods, the class can regroup.
Invention
- Each learner in the group should choose a number from 1 to 4 (or up to the number of students in the group), which will serve to identify the student from each group who will be solving the problem.
- Randomly choose a number, and the student from each group with that number should come to the board.
- After sufficient time seated group members can provide hints and clues if necessary or give a thumbs up if they agree.
Discover
- Have learners create a problem of their own and pass it around to other group members who select a method for solving it.
- Select a couple of problems to solve with the suggested method and discuss the outcomes.
Activity - Graphs that curve
Materials
- Coordinate Graphing Notes
- Graph paper - page with 42 squares high x 32 squares wide
- Lab notes
Focus questions:
- Are graphs always straight lines?
- What if data points aren't in a straight line.
Learning outcomes:
- Plot data on an x,y coordinate and find a line of best fit. Explain how the shape of the line fits the problem.
Suggested procedures overview:
- Put students in groups, focus their attention, and assess their initial understanding of the focus questions.
- Activity - Plot data on an x,y coordinate and find a line of best fit. Explain how the shape of the line fits the problem.
Exploration
- Ask. What kind of line do you think would represent a car accelerating down a quarter mile track? accept all answers.
- What shape would on a graph would represent these? Lines sloping up. Not flat line because it needs to increase.
- I have this data that was given to a driver after their run.
- I think it would be interesting to see what it looks like if we plot it.
| Distance | Time |
|---|---|
| zero (reaction time) | .734 |
| 60 feet | 2.063 |
| 330 feet | 5.387 |
| 660 feet | 8.025 |
| 1,000 feet | 10.312 |
| 1,320 feet | 12.259 |
| Final speed | 116.14 mph |
Sample plot.

Time it takes to reach a certain distance for a car on a quarter mile track.
Source Corvettes, Curve Fitting, and Calculus. by Jaclyn M. Murawska, Keith A. Nabb, Introduction by Kenric Davies, Liza Bondurant, Kristen. A. Volume/Issue: Volume 119: Issue 10 Page(s): 818–827.
The challenge given to learners, that extends to calculus ,was: How many seconds did it take the car and driver to reach 60 mph (4.1 seconds). [60 mph ≈88 feet per second
While this problem is beyond middle level learners the graphing of the data to explore an example of a curved graph to represent acceleration is.
Sharing the equation can be to illustrate the power of mathematics, what is possible, and awaits them in their futures!
Invention
- Ask. What did we represent on the x axis? time
- What unit was used? Seconds
- What did we represent on the y axis? distance
- What is the manipulated variable? distance
- What is the responding variable? time
- What is the independent variable? distance
- What is the dependent variable? time
- What is the relationship? As the distance increases the time increases. As the acceleration increases the time to cover the same distance decreased.
- The lesson can stop here!
- If you are adventurous you might ask where the car might be when it reached 60 mph.
First, what do we know, acceleration isn't consistent, shifting gears causes variability (might want to show video or a car in a drag race.) Acceleration doesn't start right away (reaction time). Final rate is 116.14 mph. So 60 mph was somewhere in between.
Discovery - another curved line graph
Graph products 1-25
Ask. What shape do you think the line would be for the products of different numbers?
Like: 0 & 25, 1 & 24, 2 & 23, 3 & 22, 4 & 21, 5 & 20, ... 12 & 13, 13 & 12, 14 & 11, 13 & 12, 14 & 11, ... 24 & 1, 25 & 0.
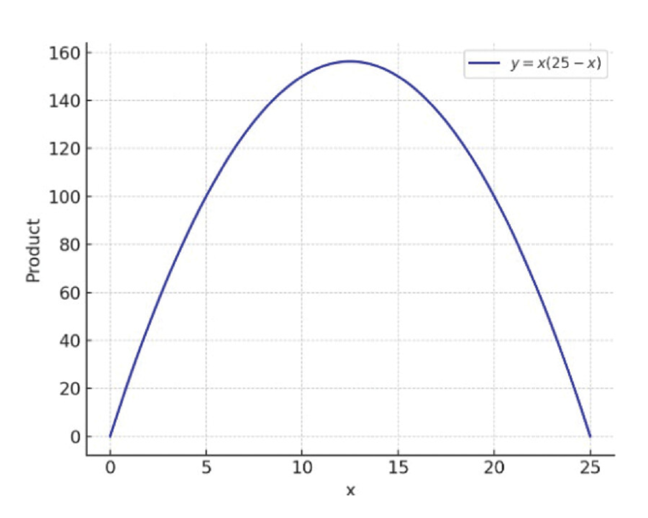
Product of factors one to 25
Source
Split 25: From Addition to Calculus. by Ian Maurer DOI: Page(s): 801–804.
The article challenges learners to identify addends that adds to 25 . Then they are given a score (the product of the two). They are challenged to find the highest score,
Discovery - Another curved graph

The King's Chessboard
One Grain of Rice
Are stories where a person is rewarded with one grain of rice that doubles for a certain number of days.
Read one of the stories and challenge them to find the grains of rice needed to for the first week.
Graph the first seven days of doubling.
Challenge them to continue doubling for another week.
Discuss what the graph would do.
Could ask about the doubling penny story where a person was asked how to receive a reward. One million dollars or a penny the first day doubled each day for a month.
Lab Notes for activities
Lab notes 1 - Meat or cheese sandwich
Materials
- Coordinate Graphing Notes
- Graph paper - page with 42 squares high x 32 squares wide
- Lab notes
Focus questions:
- How can I make a mathematical representation for sandwiches?
Challenge
First fill in the table.
| Sandwiches | Slices of Bologna or American cheese | Slices of bread |
|---|---|---|
| 1 | ||
| 2 | ||
| 3 | ||
| 4 | ||
| 5 | ||
| 6 | ||
| 7 | ||
| 8 | ||
| 9 | ||
| 10 |
Draw and label a graph for the relationship of your made your way sandwiches!
- Label the axes using the correct units.
- Provide a title that is a relationships.
- What is the slope?
- What is the x intercept?
- What is the y intercept?
- What is the equation for the line?
Lab notes 2 - Make it your way
Materials
- Coordinate Graphing Notes
- Graph paper - page with 42 squares high x 32 squares wide
Focus questions:
- How can I make a mathematical representation for my favorite sandwich?
Challenge
Design your favorite sandwich with up to (six) fix-ens.
Then fill in the table.
| Sandwich | ||||||
|---|---|---|---|---|---|---|
| 1 | ||||||
| 2 | ||||||
| 3 | ||||||
| 4 | ||||||
| 5 | ||||||
| 6 | ||||||
| 7 | ||||||
| 8 | ||||||
| 9 | ||||||
| 10 |
Draw and label a graph for the relationship of your made your way sandwiches! Use different colors for each fix-en.
- Label the axes using the correct units.
- Provide a title that is a relationships.
- What is the slope?
- What is the x intercept?
- What is the y intercept?
- What is the equation for the line?
Lab notes 3 - Select a pattern and graph it
Materials
- Coordinate Graphing Notes
- Graph paper - page with 42 squares high x 32 squares wide
Focus questions:
- How to make graphs from patterns
Challenge
Find a pattern, explain it, and make graph of its relationship
Lab notes 4 - Graphing patterns - from pattern to graph
Materials
- Patterns -
- Coordinate Graphing Notes
- Graph paper - page with 42 squares high x 32 squares wide
Focus questions:
- How are patterns graphed?
Challenge
Select a pattern and represent it on a graph.
Lab notes 5 - Tee shirt decisions
Materials
- Coordinate Graphing Notes
- Graph paper - page with 42 squares high x 32 squares wide
Focus questions:
- How can you best illustrate the cost of different amounts of goods that shows their range of pricing for different amounts of items?
Challenge
A research group of students researched prices for tee shirts and found two companies they thought would provide them for your group, but they aren't sure which would be best.
Here is the information for the two companies.
Make a graph to use to explain similarities and differences between the cost for different amounts of t-shirts from the two different companies that shows the relationships between quantity of shirts and their price.
Ink & Cotton
T-shirts with your team name and logo!
$15.00 per shirt (S, M, L)
Urban Tee Co.
T-shirts with your team name and logo! (S, M, L)
One time set up charge of $50.00
$10.00 per shirt
Lab notes 6 - Not all data makes nice line graphs
Materials
- Factor table
Challenge
How many rectangles or arrays can be made with the following?
| Number to square | Squared | Number of arrays | List of arrays |
|---|---|---|---|
| 1 | 1 | 1 | 1 X 1 |
| 2 | 4 | ||
| 3 | |||
| 4 | |||
| 5 | |||
| 6 | |||
| 7 | |||
| 8 | |||
| 9 | |||
| 10 |
Notes
Lab notes 7 - Solving for two unknowns four ways
Materials
- Lab notes, graphing calculator, graphing data sheet,
Challenge
Notes
Graphing - Ralph started a lawn service business and is going to pay him self two dollars an hour more than what he is paying Chris. What equation will describe both salaries? What would the wages be for different hour amounts? What would a graph of this relationship look like?
Substitution -
Addition -
Determinants
Support materials
Solutions for Solving for two unknowns four ways
Graphing Method
x + y = 4
x – y = 4
y = x + 4
y = x – 4
Solution: (4, 0)
x | y
____
0 | 4
1 | 3
2 | 2
3 | 1
4 | 0
Substitution Method
3x + 5y = 3
x + 4y = 8
3(8-4y) +5y = 3
24 – 12y + 5y = 3
-7y = -21
y = 3
x = -4
Solution: (-4, 3)
Determinants Method
3x – 2y = 7
3x + 2y = 9
D = 3 -2 = 6 – (-6) = 12
3 2
Dx = 7 -2 = 14 – (-18) = 32
9 2
Dy = 3 7 =27 – 21 = 6
3 9
x = Dx/D = 32/12 = 8/3
y = Dy/D = 6/12 = ½
Solution: (8/3, ½)
Addition Method
x + y = 2
3x – 2y = 0
2x + 2y = 4
3x – 2y = 0
5x = 4
X = 4/5
4/5 + y = 2
y = 10/5 – 4/5
y = 6/5
Solution: (4/5, 6/5)
Python code to generate bar chart for factors less than 20
import matplotlib.pyplot as plt
def count_factors(n):
# Counts how many positive integers divide evenly into n
return sum(1 for i in range(1, n + 1) if n % i == 0)
# Define the range of whole numbers (1 to 20)
numbers = list(range(1, 21))
factor_counts = [count_factors(x) for x in numbers]
# Create a clean, discrete bar graph
plt.figure(figsize=(10, 5))
plt.bar(numbers, factor_counts, color='royalblue', edgecolor='navy', width=0.6)
# Formatting the chart
plt.title("Number of Factors for Whole Numbers (1 to 20)", fontsize=14, fontweight='bold')
plt.xlabel("Whole Number (x)", fontsize=12)
plt.ylabel("Number of Factors (y)", fontsize=12)
plt.xticks(numbers) # Ensure every integer from 1 to 20 is labeled
plt.yticks(range(0, max(factor_counts) + 2))
plt.grid(axis='y', linestyle='--', alpha=0.5)
# Display the plot
plt.show()